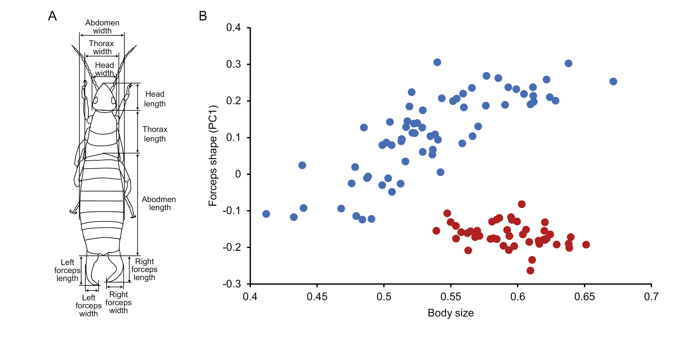
Figure 1.Measurement points and morphological analysis. A, linear measurement of head, thorax, abdomen, and forceps. B, PCA plot of body size and forceps shape. The x-axis shows body size, expressed as the logarithm of the geometric mean of all linear measurements (mm). The y-axis shows forceps shape, which is explained by the first principal component (PC1). Large y-axis values indicate short and thick forceps, and small values indicate long and thin forceps. Blue circles indicate males and red circles indicate females.